Stock View Project Beta Version 0.1
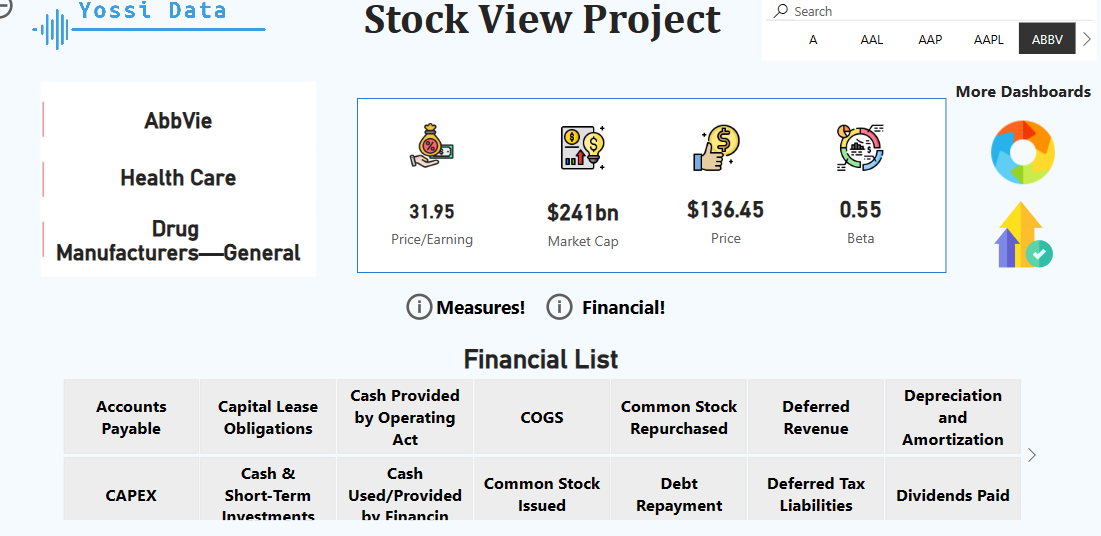
This project is centered around creating a comprehensive and insightful financial dashboard. This dynamic dashboard serves as a centralized hub, presenting a range of key financial metrics and statements. With an emphasis on clarity and user-friendly visualization, the dashboard provides an intuitive interface for users to analyze and monitor various aspects of their financial data.

Streamlining Efficiency with Macros Working with Multiple Files in Excel
In today's fast-paced business environment, efficiency is paramount. As a BI Developer, I have found that working with multiple files and leveraging macros can significantly enhance productivity.

A Glance at Stock View: Using Python to Retrieve Data
Using Python provides analysts with the ability to retrieve and handle large volumes of data efficiently. The language's extensive libraries and tools make it a valuable asset for data retrieval tasks.
Creating StockView
This project is centered around creating a comprehensive and insightful financial dashboard. This dynamic dashboard serves as a centralized hub, presenting a range of key financial metrics and statements. With an emphasis on clarity and user-friendly visualization, the dashboard provides an intuitive interface for users to analyze and monitor various aspects of their financial data.